180
Writing to Learn
Writing-to-learn activities help you think more deeply about whatever you are learning. Use the techniques on these two pages in any class.
- ▶ Admit/exit slips engage your brain at the beginning of a lesson and give you the opportunity to reflect on your learning at the end. You can write questions, comments, observations, or reflections about the material presented.
- ▶ Brainstorming is the process of writing down as many ideas as possible, as quickly as possible, without pausing to evaluate them. To brainstorm, pose a question and answer it in as many ways as possible. (See page 87 .)
- ▶ Class minutes are notes that record what happens in a class as if it were a meeting. By keeping class minutes, you enhance your learning, produce a record of what was covered, acquire a study aid, and help students who are absent. (See page 91 .)
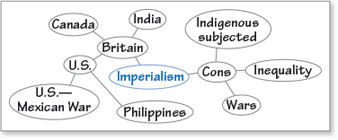
- ▶ Clustering or mind mapping is a form of brainstorming in which you record a topic in the center of a piece of paper and make as many connections or associations around it as you can. This technique provides a visual of your thoughts on a topic. (See page 50 .)
- ▶ Correspondence involves writing a letter or an email to a person connected to an event or topic you are studying. Examples include a letter to a Civil War general or one to Robert Oppenheimer, father of quantum mechanics.
- ▶ Dialogues are made-up conversations between yourself and another person (or two). Your written script of an interview with Mao Tse-tung or Madame Curie would be an example.
- ▶ First thoughts are your initial ideas about a topic. At the start of a new unit, write down your first thoughts in a paragraph. This will remind you of what you already know about the topic.
181
- ▶ Freewriting is writing nonstop for 5 to 10 minutes about a topic. The main point is to keep going without worrying about errors. If you can’t think of anything else to write, write a phrase like “What’s next?” or “I wonder” over and over until more ideas pour out. This activity helps you think through ideas. (See page 349.)
- ▶ Learning logs are journals in which you reflect on what you are learning. Keeping a learning log gives you the chance to explore and deepen your understanding of new concepts. (See pages 130-131 .)

- ▶ Listing is simply writing items in a column, trying to remember each important detail. A list offers you a way to record many facts, steps in a process, and so on. A list can also evolve into an outline or a plan of action.
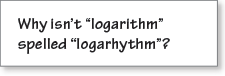
- ▶ Nutshelling is writing the main idea of a lesson in a single sentence. This technique gets its name from the idiom “put it in a nutshell” (the smallest possible space).
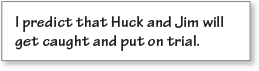
- ▶ Predicting is simply writing what you expect to happen next. When predicting, you must think carefully about what has already happened. Your expectations will either be met or not, but either way, you will have thought more deeply about the material.
- ▶ Question of the day is a question that you either ask or answer in a given class session. If you write your own question, it will focus your attention on the material; if your instructor supplies a question for you to answer, you will listen and watch for crucial details.
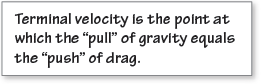
- ▶ Summarizing means capturing the main point and key details in a form briefer than the original body of information.
Your Turn Use one of these strategies to think deeply about what you learned on these pages.
182
Graphic Organizers
Graphic organizers are visual tools that can spur your thinking about any topic. You can use them to either devise new ideas or to analyze existing ones. Using the following graphic organizers will deepen your thinking in different ways.
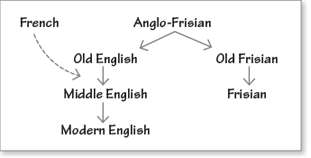
Branching Diagram
Branching diagrams trace complex relationships. You can use branching diagrams for genealogies, animal and plant groups, and related cultural developments. (Download a template.)
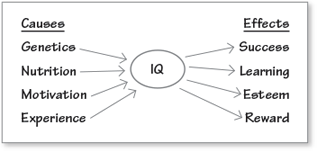
Cause-Effect Chart
Cause-effect charts trace the causes of a phenomenon, as well as its effects. Write the topic in a center circle; then list causes to the left and effects to the right. (Download a template.)
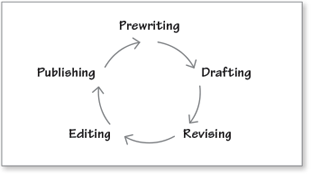
Cycle Diagram
Cycle diagrams provide a way to graph the series of steps or events in a typical process or cycle. (Download a template.)
Your Turn Use one of the graphic organizers on this page to record the details about a subject you are currently studying.
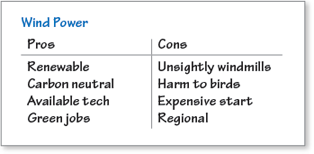
T-Bar
T-bars are two-column tables used to consider pros and cons, causes and effects, problems and solutions, similarities and differences, or any other two-part structure. (Download a template.)
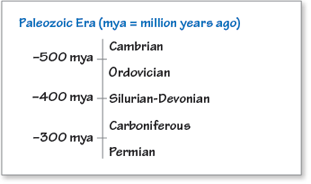
Time Line
Time lines organize information chronologically. They work well for tracking events in history and literature, and they can also outline processes and give instructions. (Download a template.)
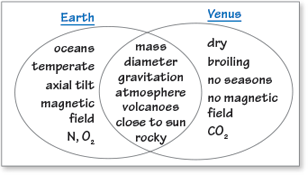
Venn Diagram
Venn diagrams compare and contrast two topics. Similarities between the topics occupy the central space, and contrasts appear in the outer circle portions under each heading. (Download a template.)
Your Turn Use one of the graphic organizers above to analyze a topic you are currently studying.
